Making the 2019 playoffs was never a sure thing for the St. Louis Cardinals. With the Brewers returning most of the team that won the 2018 division and the Cubs returning most of the team that contended until the literal last day of the season, and with the Reds and Pirates qualifying as “interesting” at worst, every single thing needed to go right for the Redbirds in 2019. Unfortunately for them, entering play on July 14th, the team’s odds for a playoff berth sit at 20%.
Still, the team is just three games out of first place and 1.5 games out of a Wild Card spot. They need every win they can get, which is why Mike Shildt should give Giovanny Gallegos more high-leverage opportunities. One of the newest Cardinals, Gallegos was part of the trade that sent Luke Voit to the Yankees last year. His name didn’t cause many eyebrows to raise; after all, at the time he had a just-okay K-BB% of about 20%. Further, Voit’s second-half performance easily overshadowed any mention of Gallegos’ name.
But 2019 is different. Gallegos now features a stellar 33.3% K-BB rate, behind that of only four qualified relievers: Josh Hader, Ken Giles, Will Smith, and Kirby Yates. (You may have heard of these guys.) He’s missing bats like never before, and when hitters do get the bat on the ball, they’re not doing much. While everyone and their little brother is hitting 20+ dingers, Gallegos’ HR/9 rate dropped year-to-year. It’s not a fluke; his xWOBA fell from .304 last year to .260 where it sits now. This ranks 25th out of the 388 pitchers who’ve faced at least 100 batters.
Gallegos came to my attention because I developed a simple model to identify pitchers who consistently throw quality pitches. I defined a good pitch as one that:
- Results in a swinging or called strike, or
- Results in an xWOBA below the median xWOBA for that pitcher’s position and pitch type. For example, sliders thrown by relievers in 2019 have a median xWOBA of .199. If a pitcher throws a slider that generates an xWOBA below .199, I count that pitch as “good”.
This process yielded good-pitch rates for starters and relievers who’ve thrown at least one pitch in the major leagues this year. I then used empirical Bayesian analysis to analyze guys like Sandy Baez (10 pitches thrown, 70% good-pitch rate) alongside Derek Holland (898 pitches thrown, 45.8% good-pitch rate). Typical analysis requires a sample-size cutoff to avoid guys like Baez sorting to the top of the list, but a Bayesian approach avoids this issue.
To follow the process, I built a model that generates prior expectations for each pitcher’s good-pitch rate in 2019. The model incorporates whether the player is a starter or reliever and their pitch count. To keep things simple I ignored pitches that resulted in foul balls.
I combined these prior expectations with players’ actual good-pitch rates to produce posterior probability distributions. These distributions show us each player’s most-likely good-pitch rate and their 95% credible intervals — the range that is 95% likely to contain the player’s true good-pitch rate. This approach accounts for disparities in pitch count sample size as well as the different expectations of starters and relievers.
The following graph shows the top 25 relievers in 2019 by this method:
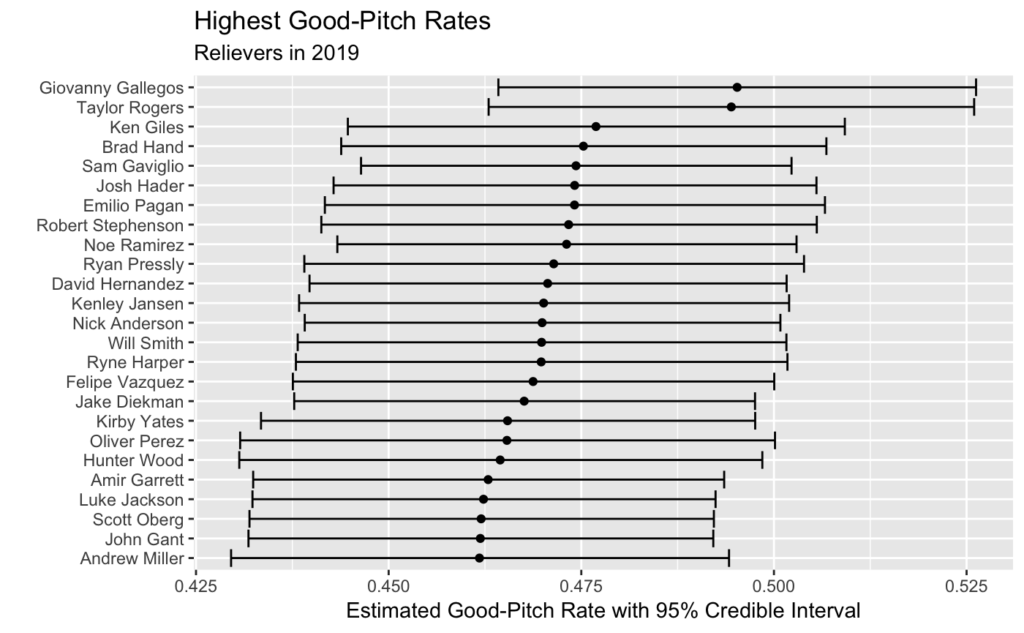
This list isn’t out of (pardon the pun) left field. Most, if not all of the guys shown here are having very good seasons. The presence of Hader, Giles, Yates, and Smith, in addition to guys like Ryan Pressley and Brad Hand, tell me this approach to measuring players has merit.
You can see why I noticed Gallegos. He likely has the highest good-pitch rate of all relievers this year, just ahead of the also-sneaky-good Taylor Rogers. While Giovanny’s credible interval overlaps considerably with others’, meaning we can’t be truly certain he’s better than the other guys on this list, his ranking is directionally correct.
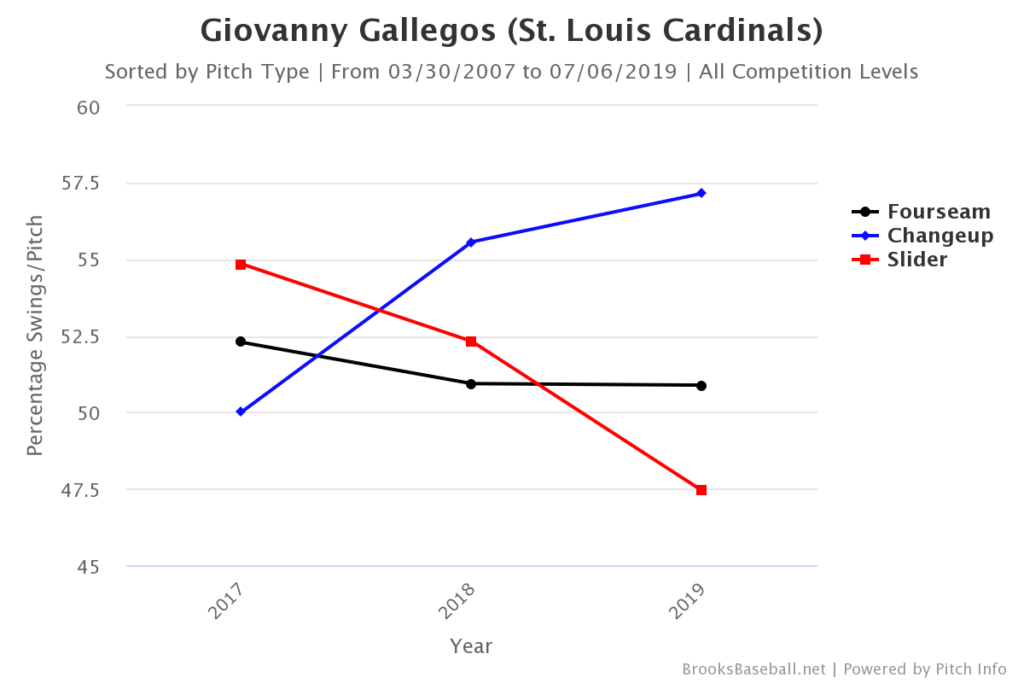
An improved slider is driving Gallegos’ performance. While hitters aren’t swinging at it like they used to:
They’re missing badly when they do swing:
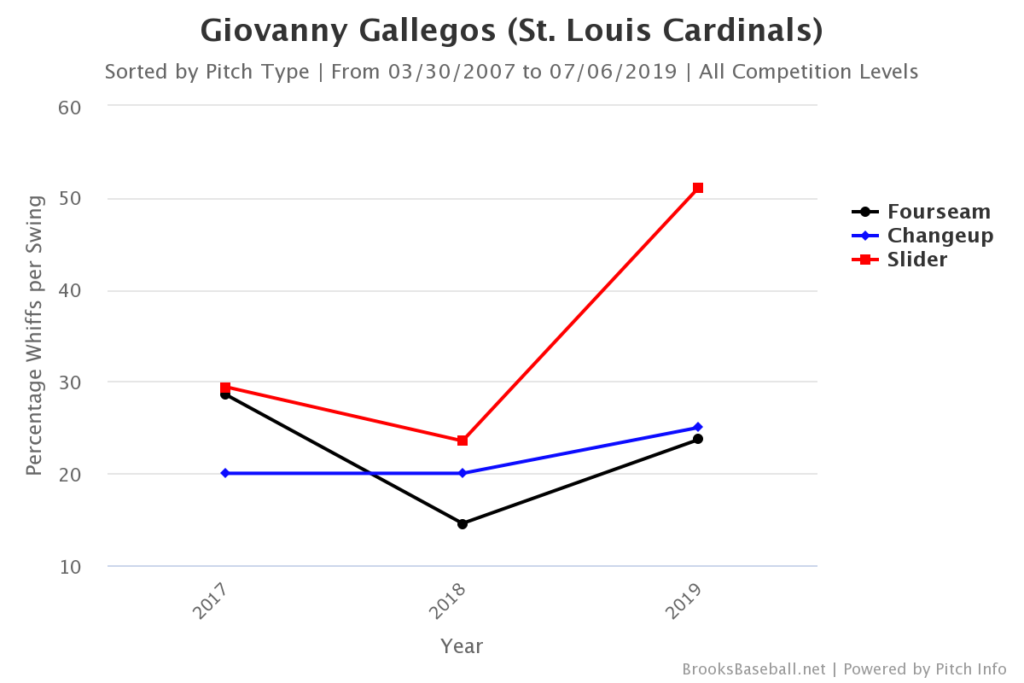
When they make contact, Statcast data shows they aren’t doing much with it:
- 2018 xWOBA vs. slider: .301
- 2019 xWOBA vs. slider: .223
Given these results, Giovanny is doing the smart thing and throwing his breaking ball more often:
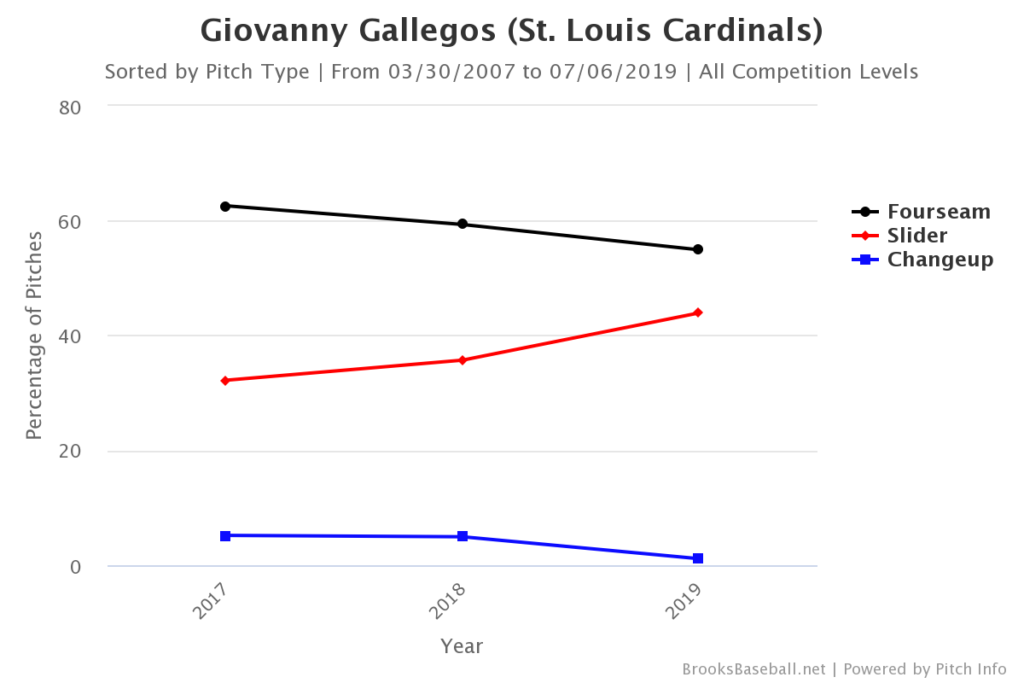
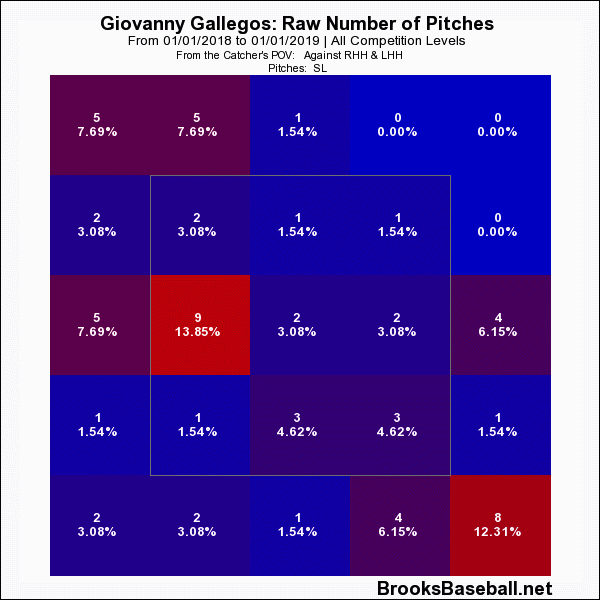
He’s commanding the pitch much more effectively. In 2018 he was all over the place with it:
This year he’s keeping it down, burying it to hitters on both sides of the plate: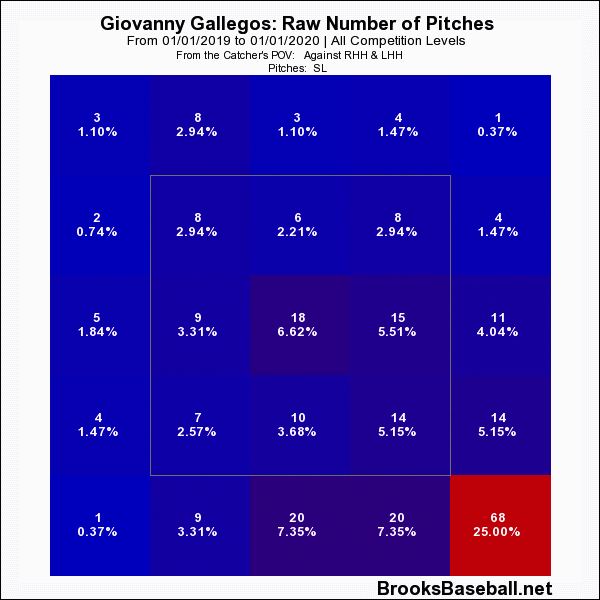
That’s where a slider’s supposed to be. The data shows that hitters can’t keep up.
Seeing him fool Ronald Acuña, Jr. drives the point home:
Yeesh.
Mike Shildt should rely on Gallegos more and more down the stretch, especially now that Jordan Hicks is on the shelf. Andrew Miller and John Gant have been good, but Gallegos makes quality pitches more often than both of them.
He’s flown under the radar for too long. The graphs above show he deserves more attention. He’s certainly doing his part to keep the St. Louis Cardinals in the 2019 playoff race.
All stats are through July 13th.
